This project focused on optimizing the mechanical supply and exhaust
ventilation system for an infectious patient ward. The optimization was
achieved by identifying the most effective placement for air supply and
exhaust points within the room, while keeping operational parameters
like total airflow and temperature constant. The primary evaluation
metric was the relative concentration of airborne pathogens in the room
volume with an occupant. A genetic algorithm was employed to efficiently
navigate the vast number of possible configurations. The study concluded
that a specific configuration of ceiling exhaust and wall-mounted supply
vents resulted in a significant reduction of pathogen concentration,
nearly halving it compared to other effective layouts, thereby improving
air quality and potentially reducing infection risk.
1. Problem Statement
The project involved optimizing the mechanical supply and exhaust
ventilation system for an infectious ward. Optimization was performed
solely by determining the best placement for air supply and exhaust
points. System parameters like total airflow rates and supply air
temperature were held constant to demonstrate the potential of this
optimization approach. The main criterion for evaluating the system’s
effectiveness was the relative concentration of pathogens in the room’s
volume with a patient present.
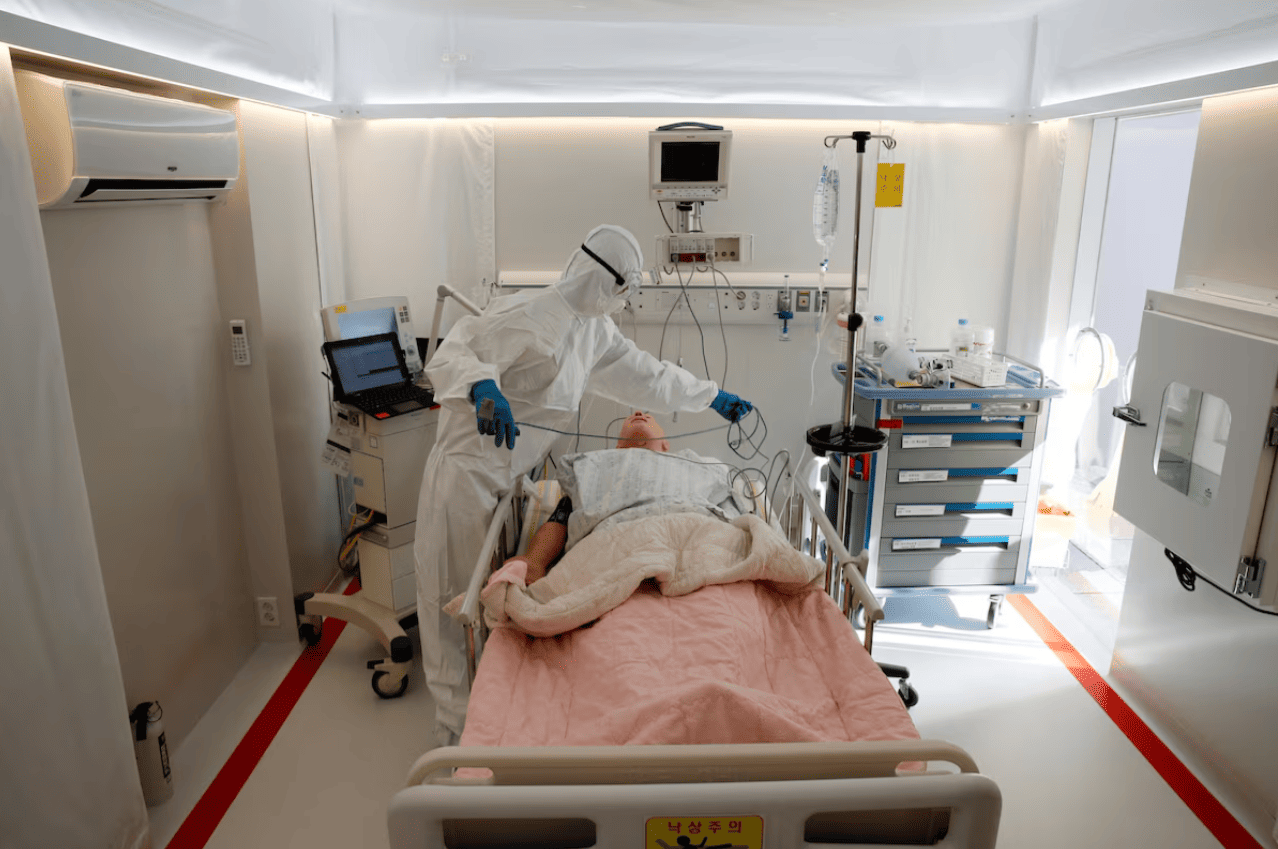
The infectious ward was represented as a simplified computational
domain for simulation. The room is rectangular, measuring 3.8⨯2.8 m
(10.6 m²) with a ceiling height of 2.8 m. Medical equipment is concealed
behind a false wall. A standard medical bed (1960⨯800 mm, 550 mm high)
is placed across from it, with a mobile cabinet (1000⨯400⨯900 mm) in the
corner.
Infectious ward geometric
model
3. Mathematical Model
Pathogens in the air have negligible mass and spread through the room
via diffusion and advective transport. Pathogen diffusion
occurs due to the thermal motion of air molecules, with its rate
determined by the concentration gradient and
quantified by the diffusion coefficient (for air, D = 10⁻⁵
m²/s). Pathogen advection is their passive movement with air flows,
generated by the ventilation system’s supply/exhaust points, patient
respiration, and natural convection from
temperature differences.
A model of diffusion-convective transport for an incompressible Newtonian fluid in a steady-state
formulation was used. As no turbulent flows were expected, the model
is described by three equations: continuity, momentum, and energy.
4. Boundary Conditions
Room air temperature, per regulatory code SP 2.1.3678-20, must be maintained at
20-26°C; thus, supply air temperature was set to 25°C. Ventilation
system capacity, per the same code, must be at least 80 m³/h per bed;
therefore, total supply and exhaust flow rates were fixed at 80 m³/h for
all configurations.
According to WHO data, patient breathing generates a
flow of approximately 6 l/min of contaminated air at about 32°C. The
human body also emits roughly 100 W of heat.
The ward is located within the building interior without external
walls or windows, so heat flow through enclosing structures (walls,
floor, ceiling) was disregarded.
5. Results Verification
A well-established mathematical model was used, requiring no
additional validation against experimental data. However, simulation
results depend heavily on correct model application. Since low mesh
quality and significant residuals are primary causes of erroneous
results, these factors were used for verification (checking the
correctness of the equation system solution).
Dilemma
5.1. Mesh Convergence
The computational mesh divides the domain into elementary volumes
(cells). The model’s equation system is solved for each cell, storing
local values for temperature, pressure, velocity, etc. Generally, more
cells yield higher detail and solution accuracy. However, increasing
mesh density raises computational load. The goal is to find the coarsest
mesh providing acceptable results. Mesh methods are sensitive to
resolution only up to a threshold, beyond which further refinement
doesn’t change the outcome. Finding this threshold is meticulous and
time-consuming work.
Use of different meshes in
simulation
In this case, the dependency of pathogen concentration in the room’s
center on mesh resolution was straightforward to interpret for selecting
the optimal mesh. The chosen mesh contained 3.4 million cells with an
average size of 5.1 mm. A calculation on this mesh took nearly 9
hours.
Mesh convergence of the
solution
5.2. Iterative Convergence
The model’s equation system is solved using an algorithm (the
semi-implicit SIMPLE method in this
case). For steady-state problems, the solution is approached
iteratively. A threshold number of iterations exists, beyond which the
result doesn’t change significantly.Δx, mm
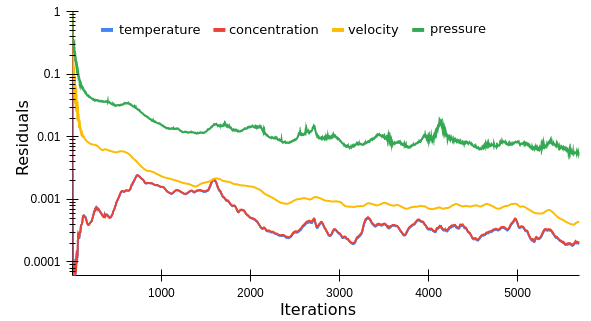
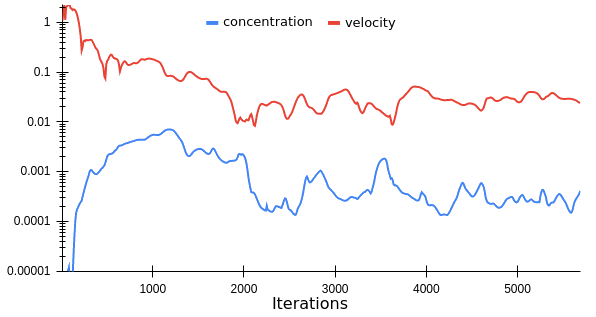
This threshold can be found by monitoring residuals and
task-significant parameters. Residuals are solution inaccuracies that
decrease to a minimum in well-configured models. Stabilization occurred
after 2,600 iterations in this case. Monitoring key parameters (pathogen
concentration and flow velocity) at a single point (room center) showed
stabilization after 4,750 iterations.
6. Optimization Search
Strategy
Optimization focused solely on the placement of air supply/exhaust
points. To explore options, walls and the ceiling were divided into
20⨯20 cm squares, and four 80⨯10 cm rectangles were defined on the
door.
Computational domain
Calculating one variant took 8.9±0.4 hours, making a brute-force
search of all combinations (2⁹⁷⁷) infeasible. A genetic algorithm was used based on these
hypotheses: 1. Exhaled air flow from the patient is primarily vertical.
2. Exhaled air rises due to its lower density (2.3% less dense, with a
7°C temperature difference from room air).
The vertical direction of the contaminated flow suggested placing
exhaust points on the ceiling above the bed. An alternative considered
placing exhaust devices in the false wall at the head of the bed,
operating as a lateral
exhaust.
Options for exhaust air point
placement
Supply air could be introduced through walls or the ceiling. One wall
faces a corridor or airlock, allowing supply only through the doorway.
The room is longitudinally symmetric, leading to four basic supply point
placement options: doorway, side walls, rear wall, and ceiling.
Options for supply air point
placement
The total surface area of supply and exhaust grilles differed between
options. This does not reduce the reliability of comparing results, as
volumetric flow rates were constant in all cases.
Labeling supply and exhaust placement options with letters and
numbers yielded 8 basic configurations.
Basic ventilation system
configurations
Configuration effectiveness was evaluated based on the proportion and
location of contaminated air. This initial assessment used a single
criterion: the volumetric share of contaminated air. A normalized
pathogen concentration threshold of C* = 1‰ was used.
Share of contaminated air for different
configurations
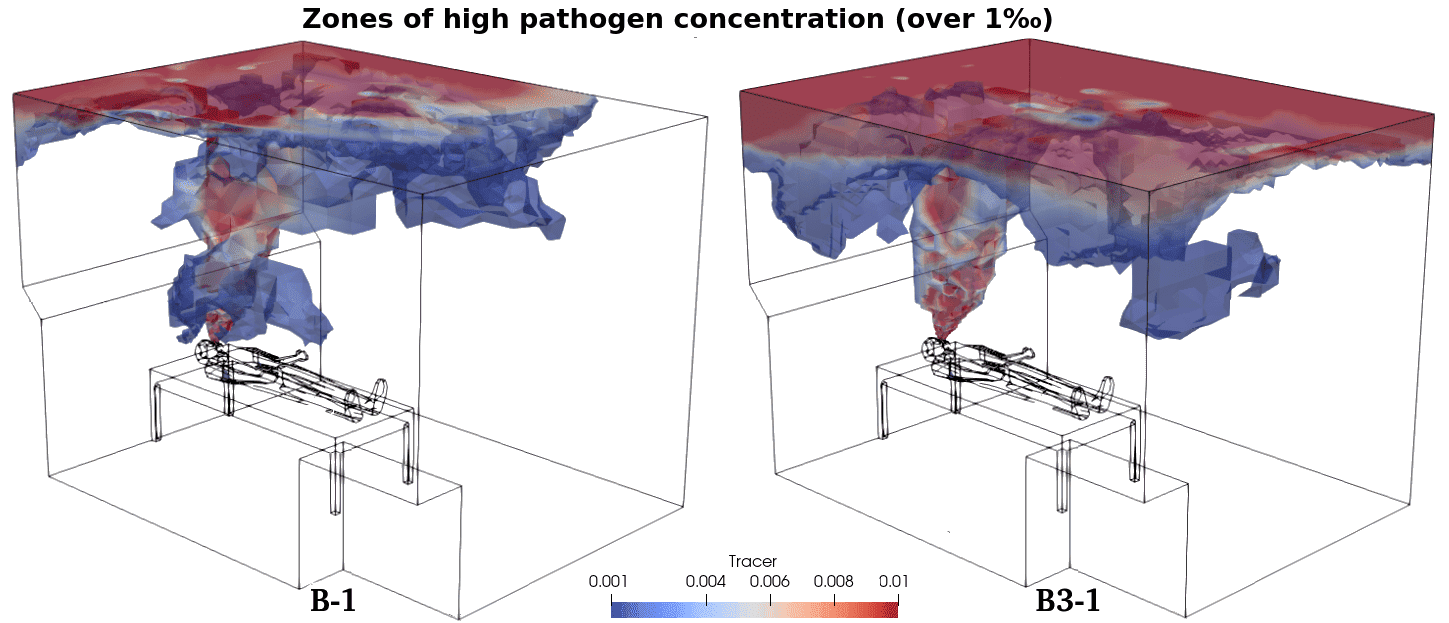
Based on initial results, only two configurations (B-1 and C-1) were
selected for further transformation. Subsequent analysis identified
configurations B-1 and B3-1 as most effective at removing pathogens.
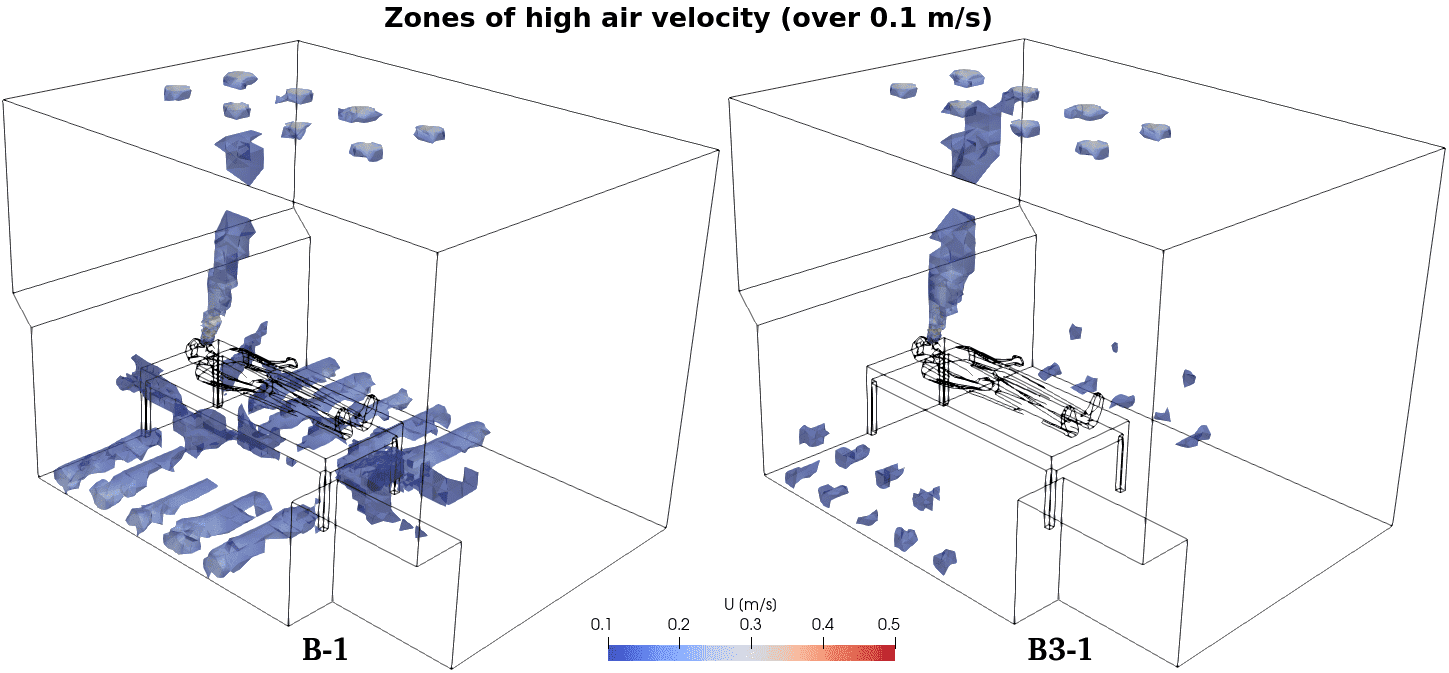
Visualization of simulation results led to the selection of
configuration B-1 as the final recommendation. This configuration
features more pronounced zones of higher air mobility (reaching 0.16
m/s), but these are located significantly below patient level and should
not cause discomfort. Configuration B-1 achieved nearly a twofold
reduction in pathogen concentration compared to configuration B3-1.


